350+ 5-Star Reviews
Solar Savings Calculator
How Much Can Solar Energy Save You?
As electricians and solar installers, the most frequent questions we get asked when it comes to solar energy are – How much can I save with solar? Is it really worth it? How long will it take to recover the money invested?
It is evident that more and more people are making the switch to solar, and that is because solar is a great option to save money and obtain energy from an inexhaustible source -the sun.
This Solar Savings Calculator can help you get an idea of how much you can save with solar, depending on your current consumption and the size of the solar panels you want to put on your roof.
Once you have set the requested parameters, you should be able to find out your:
- Estimated Annual Self-Consumption Savings
- Estimated Annual Feed-in Savings
- Estimated Total Annual Savings
If you’re unsure about any of the steps in our Solar Savings Calculator, don’t worry! We’ve provided additional information below to help clarify any questions you might have. Please keep in mind that these figures are estimates, and each individual situation may need to be evaluated by solar experts. However, if you’re comfortable with the parameters, feel free to click the link below to jump straight to the calculator:
Go to the Solar Savings Calculator
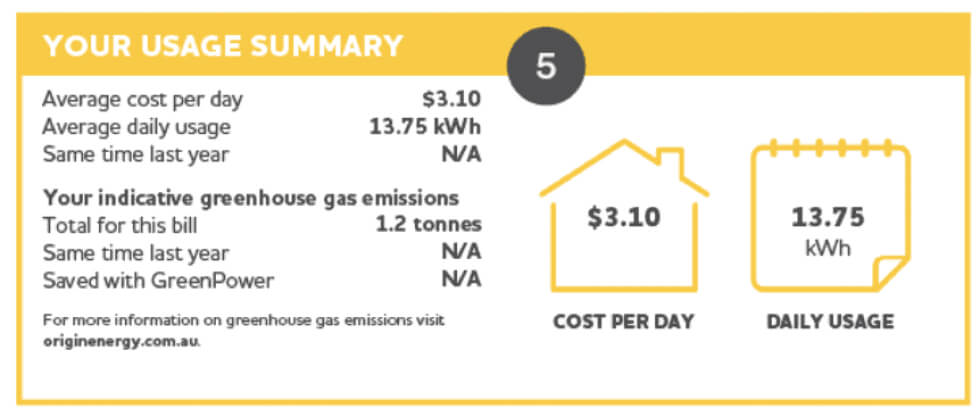
Daily Energy Usage
One of the first steps to determine how much you can save with solar and which system is right for your home is to look at your electricity bill. For example, an Australian family can consume 41 kWh per day. If you multiply that number by the QLD average electricity rate ($0.23545 per kWh), you’ll find that the typical Australian family is spending over $9 a day, which will result in more than $3,000 per year on electricity alone. ($9/day x 365 days = $3,523.50/ year).
You can find your daily consumption on your electricity bills.
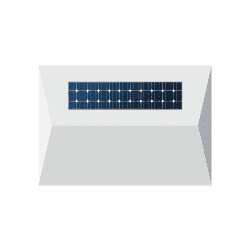
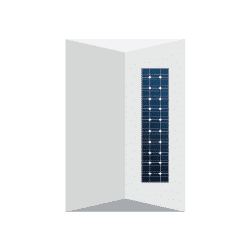
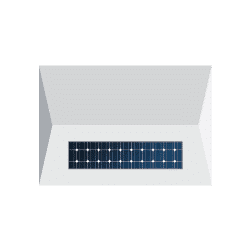
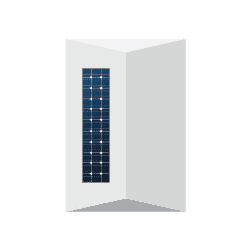
Solar Panel Orientation
What is the best direction to face solar panels in Australia?
When solar took off around ten years ago, we did our best with our information. One common conclusion we were all told was that North-facing panels were the only way, but it turns out that there is more than one way to skin a cat.
The sun rises from the East and sets in the West, so we can achieve the same daily production of a North-facing roof by having a system with panels evenly split between East-West. But sometimes, when there are no other options, having panels on a South-facing roof can still yield results!
Solar System Size
There is no one-size-fits-all solution for solar panels; however, giving a closed answer to this question without a previous household energy assessment is complicated.
The power of the system you’ll need depends on several factors. For example, you can read more about this in our article “Solar Panels: The Ultimate Guide to Get the Right Solar System for Your Home.”
We have created this table to give you an approximate idea of the number of solar panels and the installation size. Remember that these numbers are approximate and that several factors can affect the actual size of your system.
Feed-in Tariff
As you may already know, you can sell the extra energy you produce to the Queensland electricity network. The Queensland Government’s Solar Bonus Scheme pays a feed-in tariff for the surplus electricity generated from solar power systems. Each company has different solar feed-in tariff rates and conditions.
However, the average rate in Queensland is 7.5 per kWh. So if you need help finding the best company to sell the extra energy that you produce, you can contact us, and we will be happy to help you with any questions.
| System Size | Number of Panels | Power Generated | Roof Space |
|---|---|---|---|
| 3kWh | 10 | 13 kWh/day | 20-25 sqm |
| 4kWh | 13 | 18 kWh/day | 25-30 sqm |
| 5kWh | 17 | 22 kWh/day | 25-30 sqm |
| 6kWh | 20 | 26 kWh/day | 30-40 sqm |
| 7kWh | 23 | 31 kWh/day | 35-45 sqm |
| 8kWh | 27 | 35 kWh/day | 35-45 sqm |
| 9kWh | 30 | 40 kWh/day | 55-60 sqm |
| 10kWh | 33 | 44 kWh/day | 55-60 sqm |
Solar Payback Period
The Payback Period simply means how long it takes for the savings from your electricity bills to equal the value of installing a solar energy system.
When talking about Payback Periods, I am often asked: “How long does it take to recover the initial investment?”. In other words, how long will it take for you to save on your electricity bill?
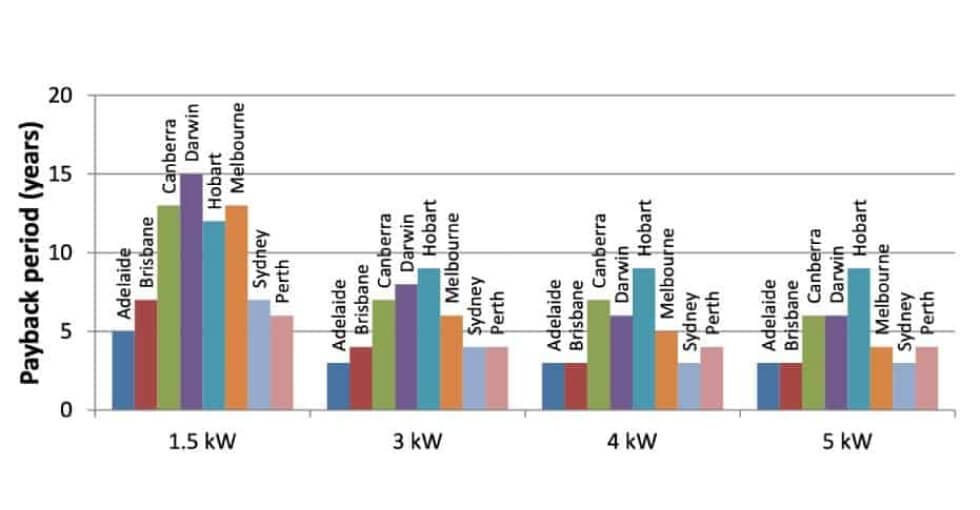
Well, I have to say that it depends on many factors, one of which is the geographic location where you live. So if you look at the graph below, you will notice that the bigger the system you install, the shorter the payback period, even though the initial investment is higher. It seems unreal, right?
But it’s true. And that is the reason why many people are now turning to solar energy. As you can see below, Queensland is one of the locations with lower Payback Period times, which makes it even better for Queenslanders to invest in a solar system.
Solar savings calculator
Step 1: Select your daily energy usage
Step 2: Choose your solar panel orientation